
Data & Performance
Management information that is not a monthly return.
Dashboards, indicators and open data drawn from the same records departments work in, so nobody retypes a number to produce a report.
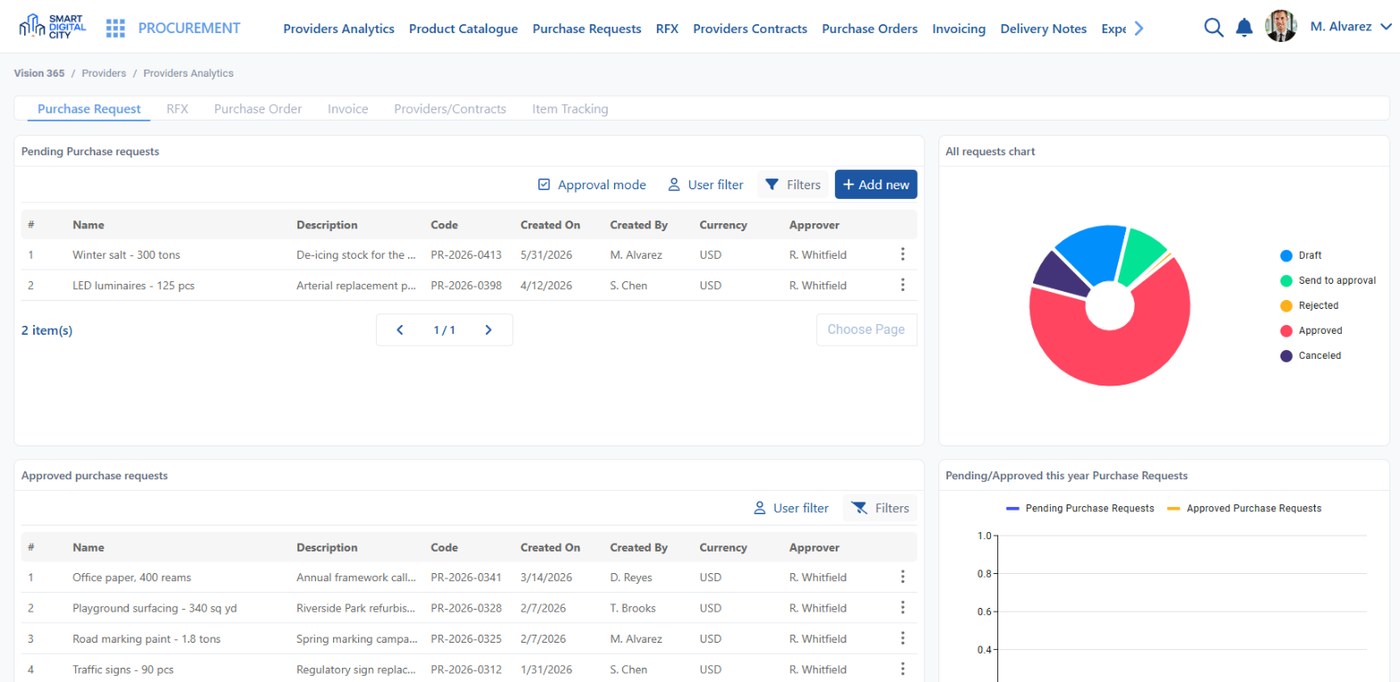
Counts and trends read from the records, not from a monthly return.
What changes
Numbers nobody retypes
Every figure traces to the records it was computed from, and updates when they do.
One definition per indicator
Response time means the same thing in two departments because it is defined once.
Open data without a project
A published dataset is a view of live records, refreshed on its own schedule.
Key capabilities
Operational dashboards
Open work, overdue cases and today’s load, per department and per crew.
Service performance
Response and resolution times against the targets published in the service catalog.
Financial execution
Budget against commitment and spend, by department, program and funding source.
Asset and works indicators
Condition, backlog, cost per asset class and per district.
Drill-down
Any figure opens into the records behind it, so a question is answered in one step.
Open data
Selected datasets published in open formats for residents, press and researchers.
How it works
Define the indicator
What counts, what is excluded and over what period, agreed once and recorded.
Compute from the source
The figure is calculated from the operational records, not from an extract.
Publish to the right audience
Internal dashboards, council reporting and public datasets from the same definition.
Investigate a figure
Drill through to the cases, work orders or invoices behind the number.
Review and adjust
A changed definition is versioned, so past reporting stays explainable.
Data & Performance works with the systems your city already runs.
ERP · Finance · GIS · Work Orders · Open data · BI tools · REST API
Related solutions
Capital Projects
Program reporting on stage, cost and delivery.
Learn more →Case & Workflow Management
The case records most service indicators are computed from.
Learn more →311 & Service Requests
Response times on resident requests.
Learn more →Report from the records, not from a spreadsheet
See how Smart Digital City computes indicators from the work itself and publishes them where they are needed.